
GBP/USD weekly: sell a rebound into 1.3518–1.3561, target 1.3045
FXFibo editorial · · 1 min readOn the weekly chart, GBP/USD is squeezed between the falling trendline from the highs (around 1.3600) and the rising trendline from the lows (around 1.3240). The main scenario is a rebound into 1.3518–1.3561 (0.707–0.786 retracement), then a break lower towards 1.3045 and the 1.2750–1.2880 zone.
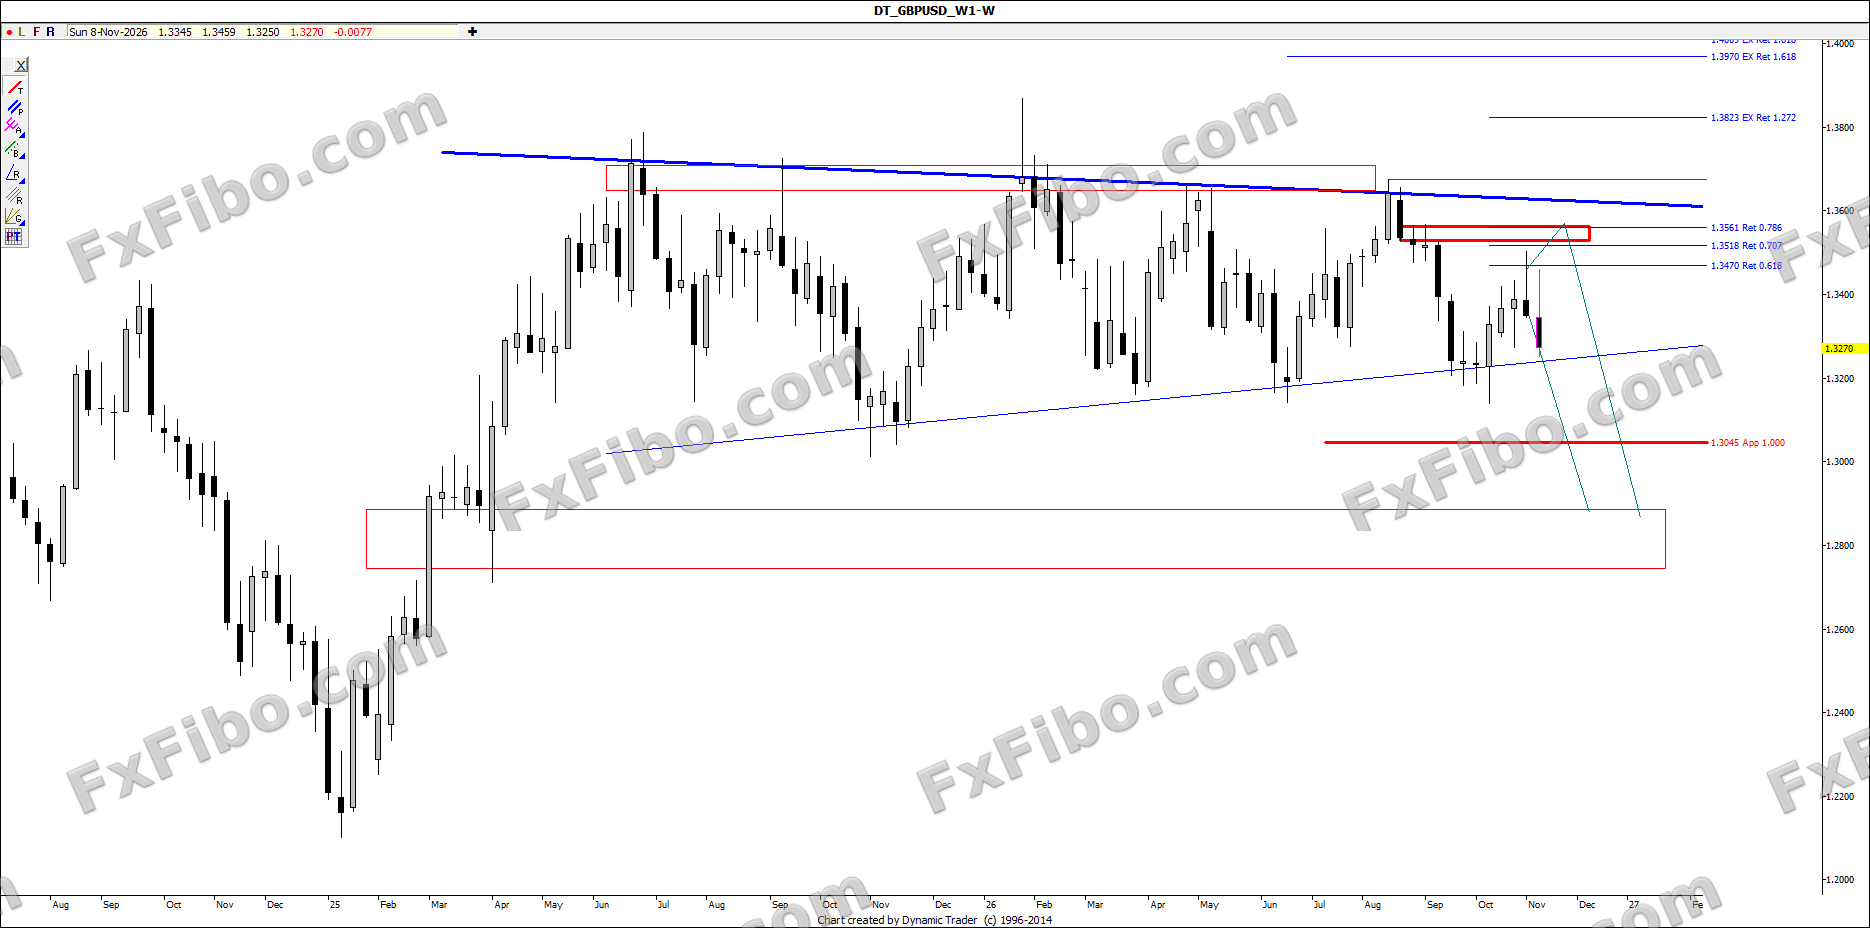
Main scenario
The 1.3518–1.3561 zone combines the 0.707 and 0.786 Fibonacci retracements and sits near the falling trendline, making it the main selling area. A break of the rising trendline around 1.3240 is the key confirmation. Target 1 is 1.3045 (1.000 equal move) and target 2 is the top of the 1.2750–1.2880 demand zone.
Alternative scenario
If price breaks the 1.3240 trendline directly without a rebound, sell the pullback into that trendline. A sustained move above 1.3650 invalidates the bearish view and opens 1.3823.
Key levels
Resistance: 1.3470 (0.618) — 1.3518 (0.707) — 1.3561 (0.786) — 1.3600 falling trendline Support: 1.3240 rising trendline — 1.3045 — 1.2750–1.2880
Market-moving events
Speeches by Fed and Bank of England officials, jobs and inflation data
The weekly structure of GBP/USD is a tightening triangle between a falling trendline from the highs and a rising trendline from the lows. The last rally stalled at the 0.618 Fibonacci retracement (1.3470), and this week's candle is bearish. The most likely path is a pullback into 1.3518–1.3561 followed by a decline towards 1.3045. A break of the rising trendline around 1.3240 would be the key signal for this scenario.