
GBP/USD 4H: sell the pullback into 1.3320–1.3335
FXFibo editorial · · 1 min readOn the 4-hour chart, GBP/USD has broken the 1.3320–1.3335 support, which now acts as resistance. The main scenario is a short pullback into this zone, followed by a continued decline towards the 1.3175–1.3190 demand zone.
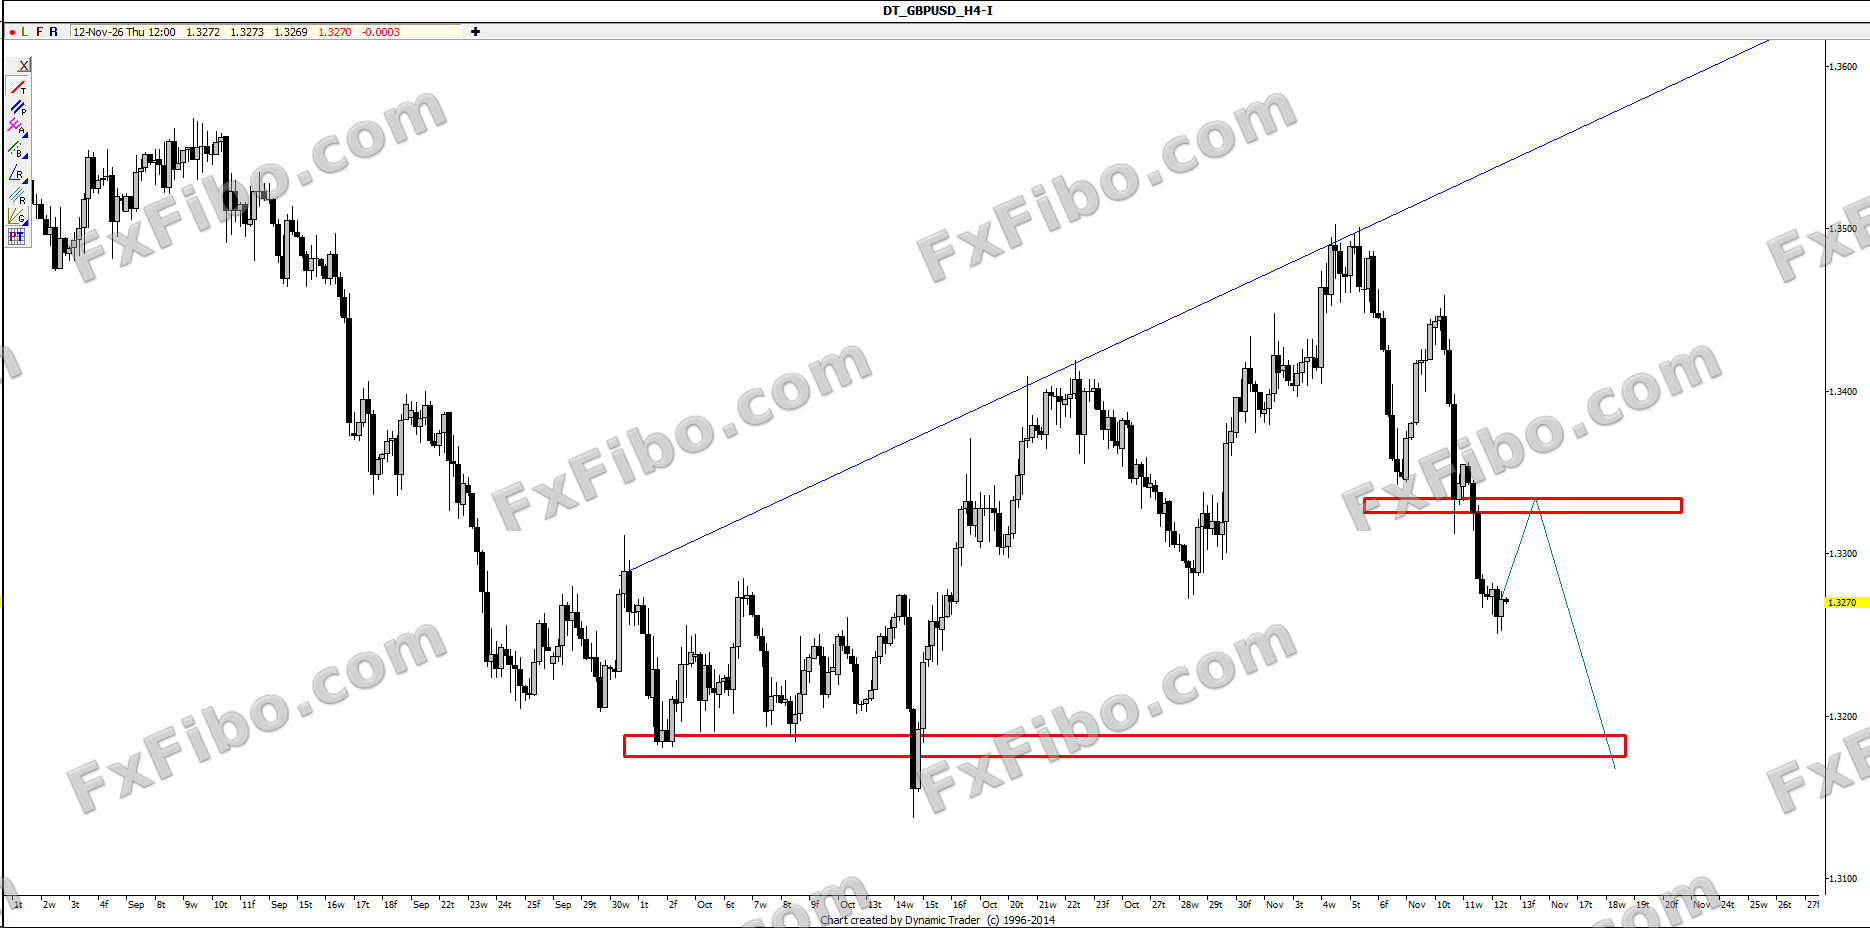
Main scenario
The 1.3320–1.3335 zone, formerly support, has turned into resistance after the break. Sell the pullback into this zone with a stop above 1.3375. Target 1 is 1.3190 and target 2 is 1.3175, the October lows.
Alternative scenario
If price keeps falling without a pullback, wait for a smaller correction to enter. A move above 1.3375 invalidates the setup.
Key levels
Resistance: 1.3320–1.3335 — 1.3375 — 1.3460 Support: 1.3250 — 1.3175–1.3190
Market-moving events
UK GDP data (released: 0.2%), Fed speakers
On the 4-hour chart, GBP/USD formed two strong bearish legs after hitting the rising trendline of the highs at 1.3500, and broke the 1.3320–1.3335 support. After such a break, price usually returns to test the broken level, where sellers step in again. The final target of this move is the 1.3175–1.3190 demand zone.