
EUR/USD weekly: sell a pullback into 1.1324–1.1354, target 1.0905
FXFibo editorial · · 1 min readOn the weekly chart, EUR/USD has broken the 1.1324 low and is now sitting on the 1.1065 low (May 2025) and the 0.5 retracement (1.1130). The main scenario is a pullback into the broken 1.1324–1.1354 zone, followed by a decline towards 1.0905 and 1.0735.
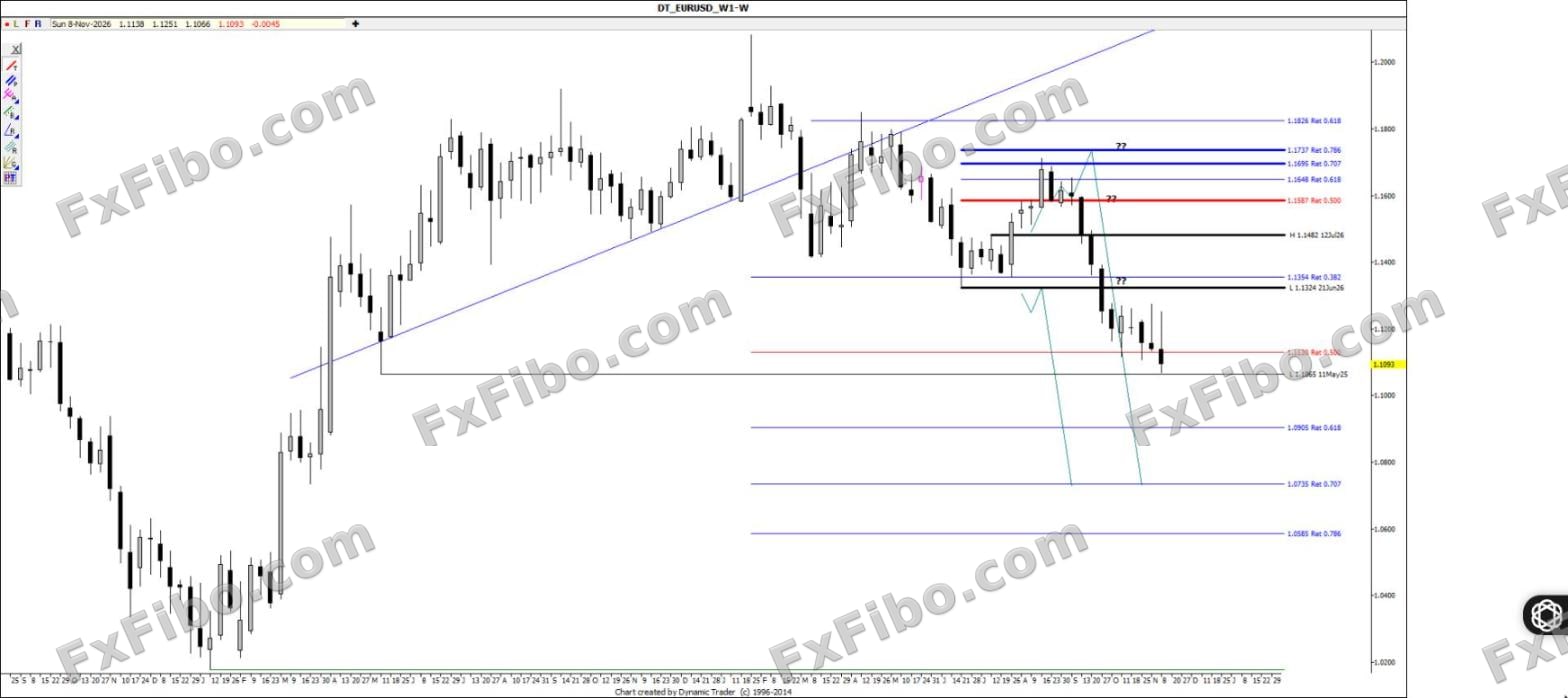
Main scenario
The 1.1324–1.1354 zone (broken June low and 0.382 retracement) is the main selling area. A break of the 1.1065 low confirms further downside. Target 1 is 1.0905 (0.618 retracement) and target 2 is 1.0735 (0.707 retracement).
Alternative scenario
If price breaks 1.1065 without a pullback, sell a retest of that level. A move above 1.1490 invalidates the setup and opens 1.1587.
Key levels
Resistance: 1.1130 — 1.1324–1.1354 — 1.1482 — 1.1587 Support: 1.1065 — 1.0905 — 1.0735 — 1.0585
Market-moving events
Fed and ECB speakers, inflation data
EUR/USD's weekly structure turned bearish after breaking its long-term rising trendline. The last rally stalled at the 0.707–0.786 retracements (1.1695–1.1737), after which the 1.1482 and 1.1324 lows were broken one by one. Price has now reached the 1.1065 low. A pullback into the broken levels would offer a better selling opportunity for the next leg down.