
GBP/USD monthly: multi-year ceiling at 1.3800, Fibonacci targets down to 1.2098
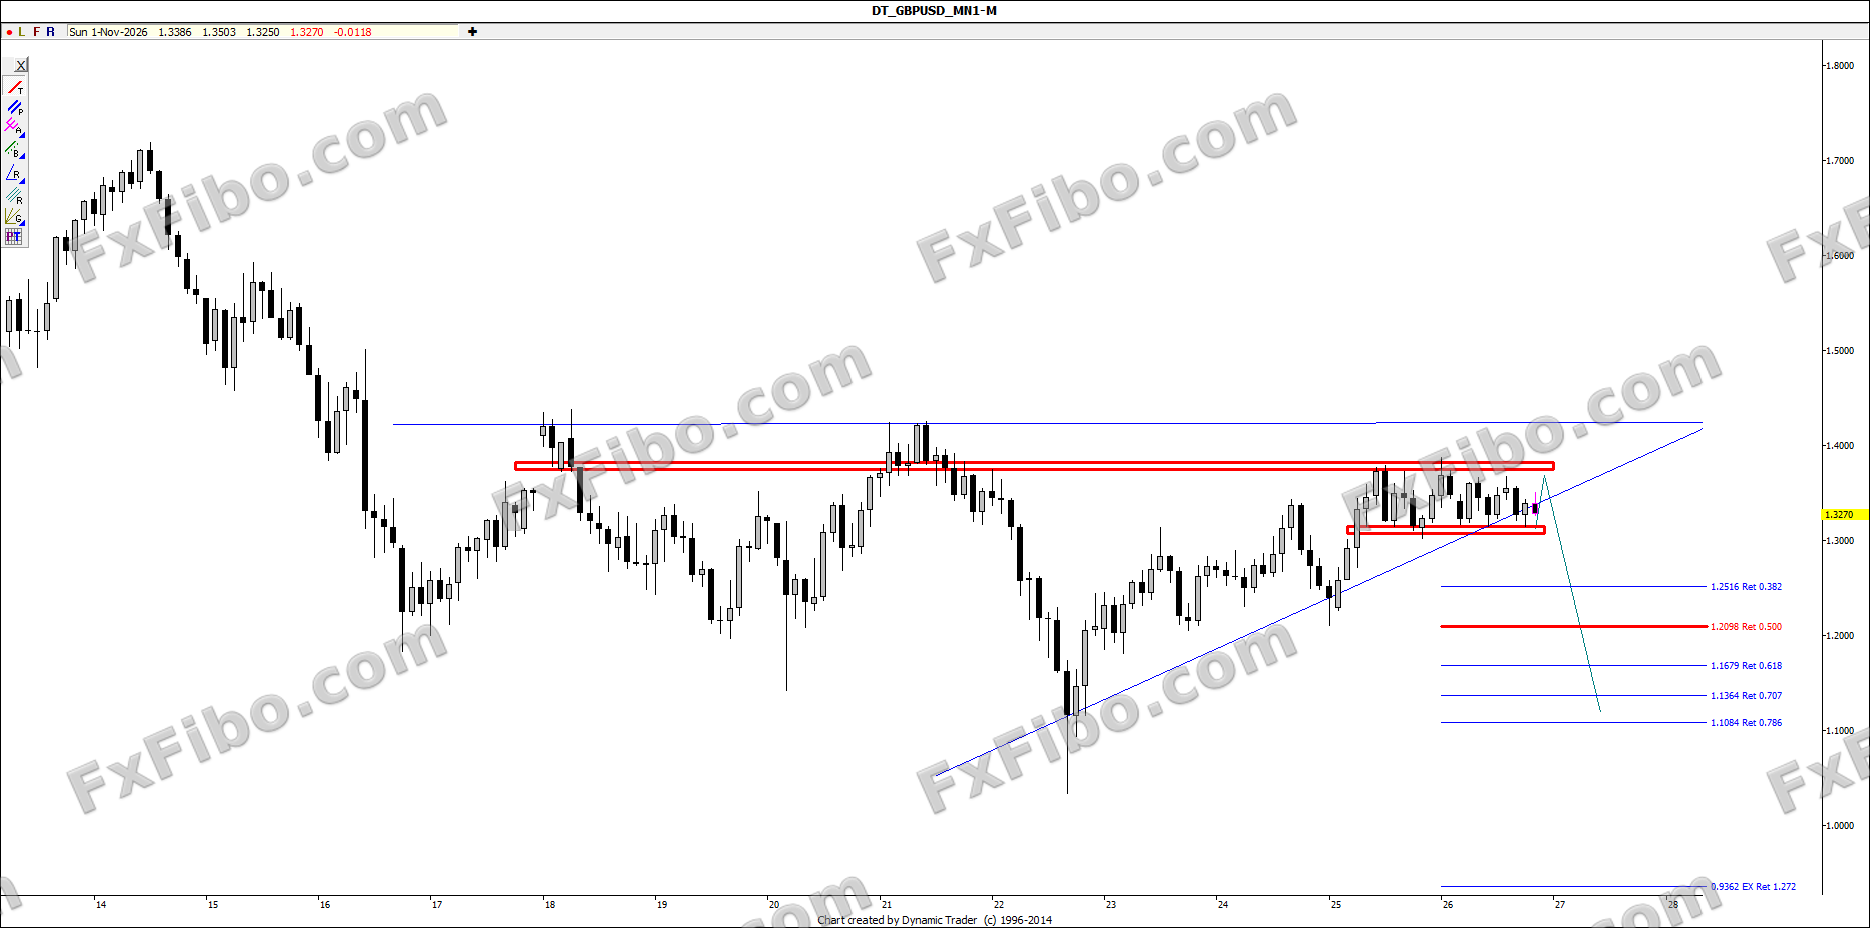
FXFibo editorial · · 1 min readGBP/USD has been capped for years by the 1.3750–1.3800 resistance and is now sitting on its long-term rising trendline and the 1.3080–1.3150 support. The main scenario is a brief rebound towards 1.3500–1.3650, then a break of the trendline and a move towards the 1.2516 and 1.2098 Fibonacci levels.
Main scenario
As long as price stays below 1.3750–1.3800, any rebound into 1.3500–1.3650 is a selling opportunity. A break of the rising trendline from the 2022 low and the 1.3080–1.3150 zone opens the way to 1.2516 (0.382 retracement) and 1.2098 (0.5 retracement).
Alternative scenario
A monthly close above 1.3850 would break the multi-year ceiling and target the 1.4200 area.
Key levels
Resistance: 1.3750–1.3800 — 1.4200 Support: 1.3080–1.3150 and the rising trendline Fibonacci: 1.2516 (0.382) — 1.2098 (0.5) — 1.1679 (0.618)
Market-moving events
Fed and Bank of England December rate decisions, US and UK inflation data
On the monthly chart, GBP/USD has traded in a tight range below the historic 1.3800 resistance since 2025. Several attempts to break this ceiling have failed, and price is now resting on the long-term rising trendline. A break of this trendline and the 1.3080–1.3150 zone would signal the end of the rally from the 2022 low, with the 1.2516 and 1.2098 Fibonacci retracements as the next logical targets. This is a long-term view; wait for confirmation on lower timeframes before entering.