
GBP/USD daily: sell 1.3300–1.3340, target the 1.3160 range floor
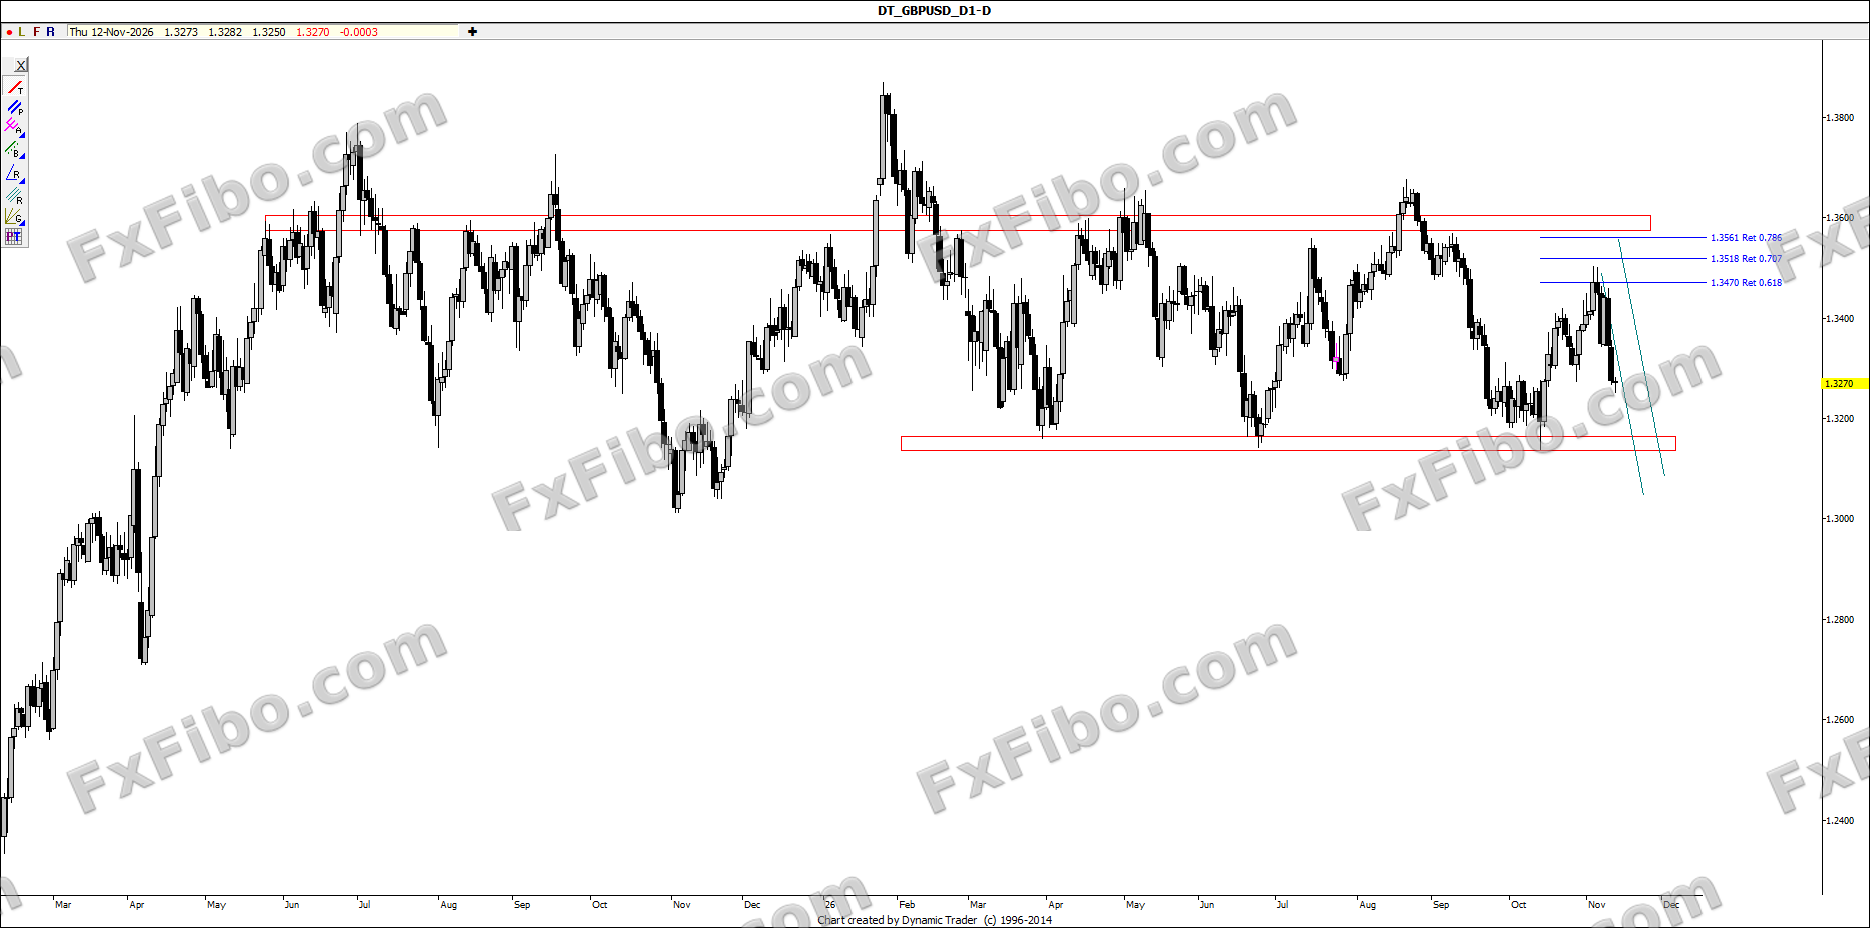
FXFibo editorial · · 1 min readGBP/USD has traded in a 1.3150–1.3600 range since early 2025. The latest rebound reversed exactly at the 0.618 Fibonacci retracement (1.3470), and price is now falling sharply towards the bottom of the range. Target 1 is the 1.3140–1.3170 zone and, on a break, 1.3050.
Main scenario
Any brief rebound into 1.3300–1.3340 is a selling opportunity in the direction of the new downswing. Target 1 is the range floor at 1.3160. A decisive break of the floor (daily close below 1.3140) opens the way to 1.3050.
Alternative scenario
If the 1.3140–1.3170 floor holds again, a fresh rebound inside the range is possible, so lock in profits at target 1.
Key levels
Resistance: 1.3340 — 1.3470 (0.618) — 1.3518 — 1.3561 — range top 1.3580–1.3600 Support: 1.3140–1.3170 range floor — 1.3050
Market-moving events
UK GDP data (released: 0.2%), Fed speakers
The daily chart shows GBP/USD trading in a horizontal range between 1.3150 and 1.3600 for almost two years, with sellers stepping in every time price approached the top. The last rally did not even reach the top of the range and stalled at the 0.618 Fibonacci retracement, a sign of weak buyers. The recent strong bearish candles make a move towards the bottom of the range likely.