
USDJPY4-hourBullish
USDJPY 4-hour (SMC): 157.26–158.77 range; buy the range low
FXFibo editorial · · 1 min readSummary
On the 4-hour chart price is ranging between 157.26 and 158.77, and clustered highs hold buy-side liquidity. In line with the daily bias, buying the lower half is preferred.
BiasBullishEntry zone157.50Stop loss157.05Target 1158.50Target 2158.77StatusActive
Invalidation: 4-hour close below 157.25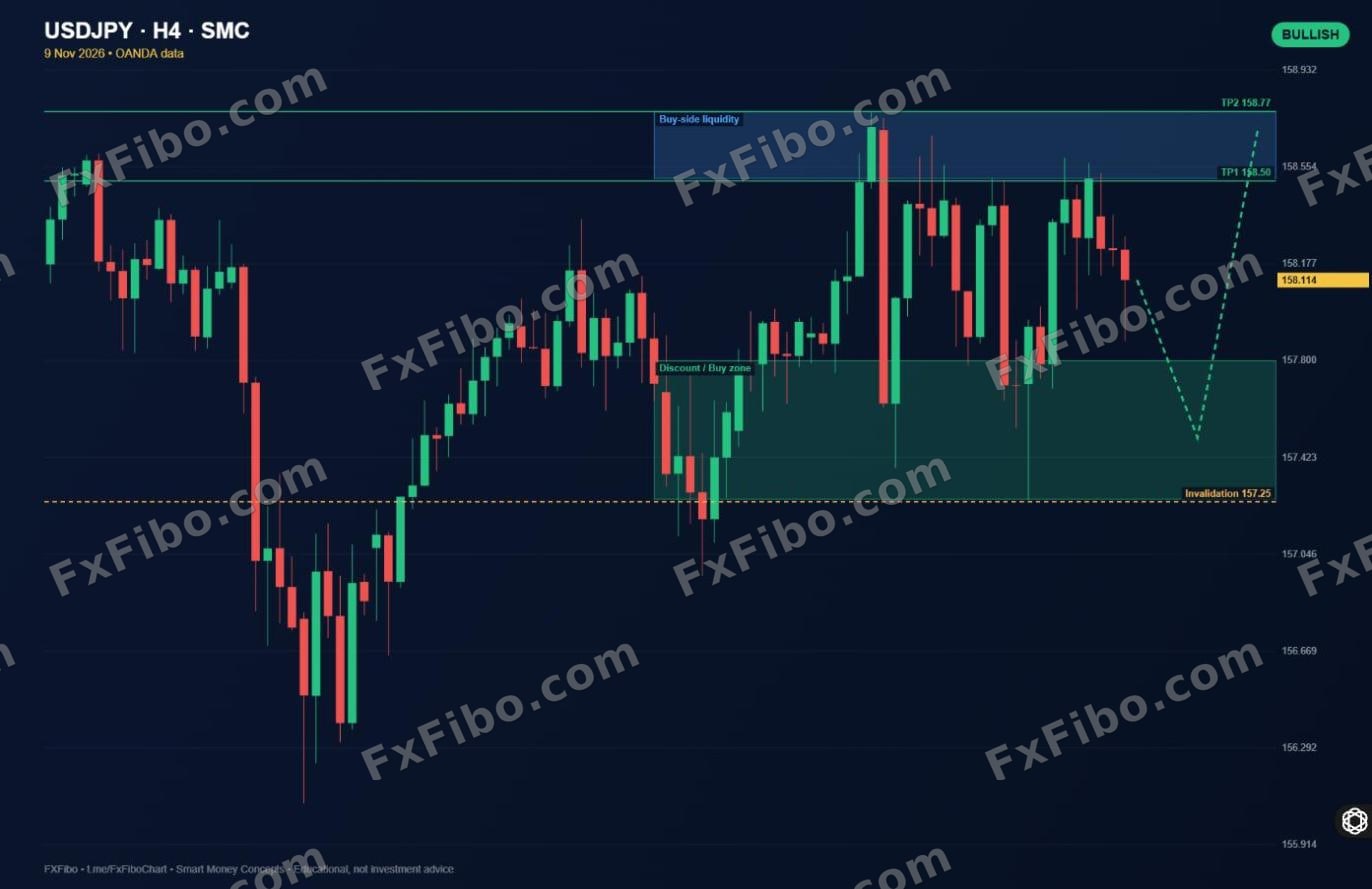
Main scenario
- Structure: range with highs at 158.51–158.77 and lows at 157.26–157.38
- Buy zone: discount at 157.26–157.80
- Targets: 158.50 and 158.77
Alternative scenario
A break of 157.25 triggers sell-side liquidity, with 156.96 next.
Key levels
- Resistance: 158.12, 158.50, 158.77
- Support: 157.80, 157.38, 157.26
Market-moving events
- Tue 10 Nov: US CPI
- Thu 12 Nov: UK GDP and US jobless claims
- Fri 13 Nov: US PPI and euro-area GDP
⚠ This analysis is educational and is not a buy or sell recommendation. Trading financial markets carries the risk of losing capital.