
US500 · Indices
S&P 500 forecast
S&P 500 (US500) analysis on monthly, weekly, daily, 4-hour and 1-hour charts, with key levels, track record and archive.
—Source: —
—No chart data
Latest analysis by timeframe
MonthlyMNNot publishedNot published
WeeklyW1Not publishedNot published
Daily10 Nov 2026Active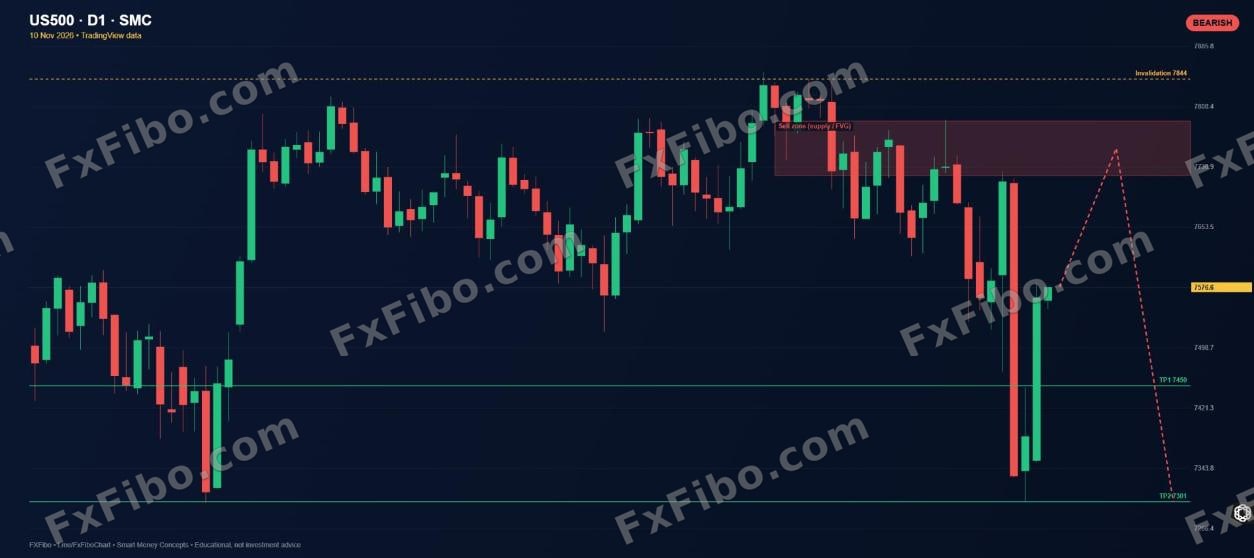 S&P 500 daily (SMC): sell the 7720–7790 zoneBearishEntry7750Stop7850Target7450Read analysis →Daily archive (1)
4-hour10 Nov 2026Active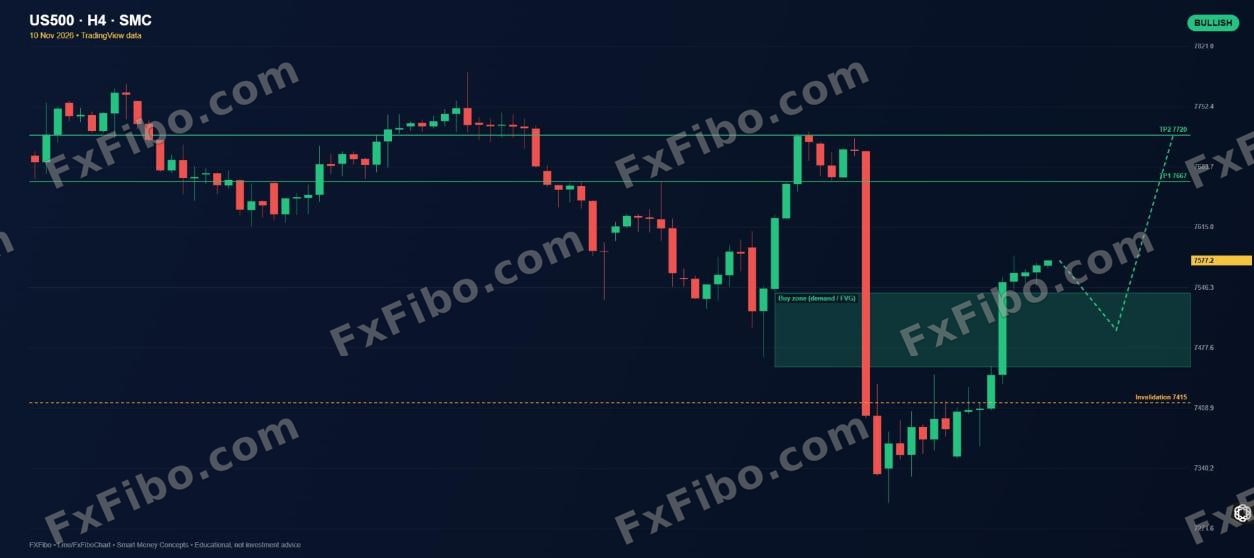 S&P 500 4-hour (SMC): buy the 7456–7540 zoneBullishEntry7500Stop7400Target7667Read analysis →4-hour archive (1)
1-hourH1Not publishedNot published
S&P 500 analysis archive
1 analyses| Date | Timeframe | Analysis | Bias | Result |
|---|---|---|---|---|
| 10 Nov 2026 | Daily | S&P 500 daily (SMC): sell the 7720–7790 zone | Bearish | Active |