
GBPUSDWeeklyNeutral
GBP/USD weekly analysis — 6 November 2026
FXFibo editorial · · 1 min readSummary
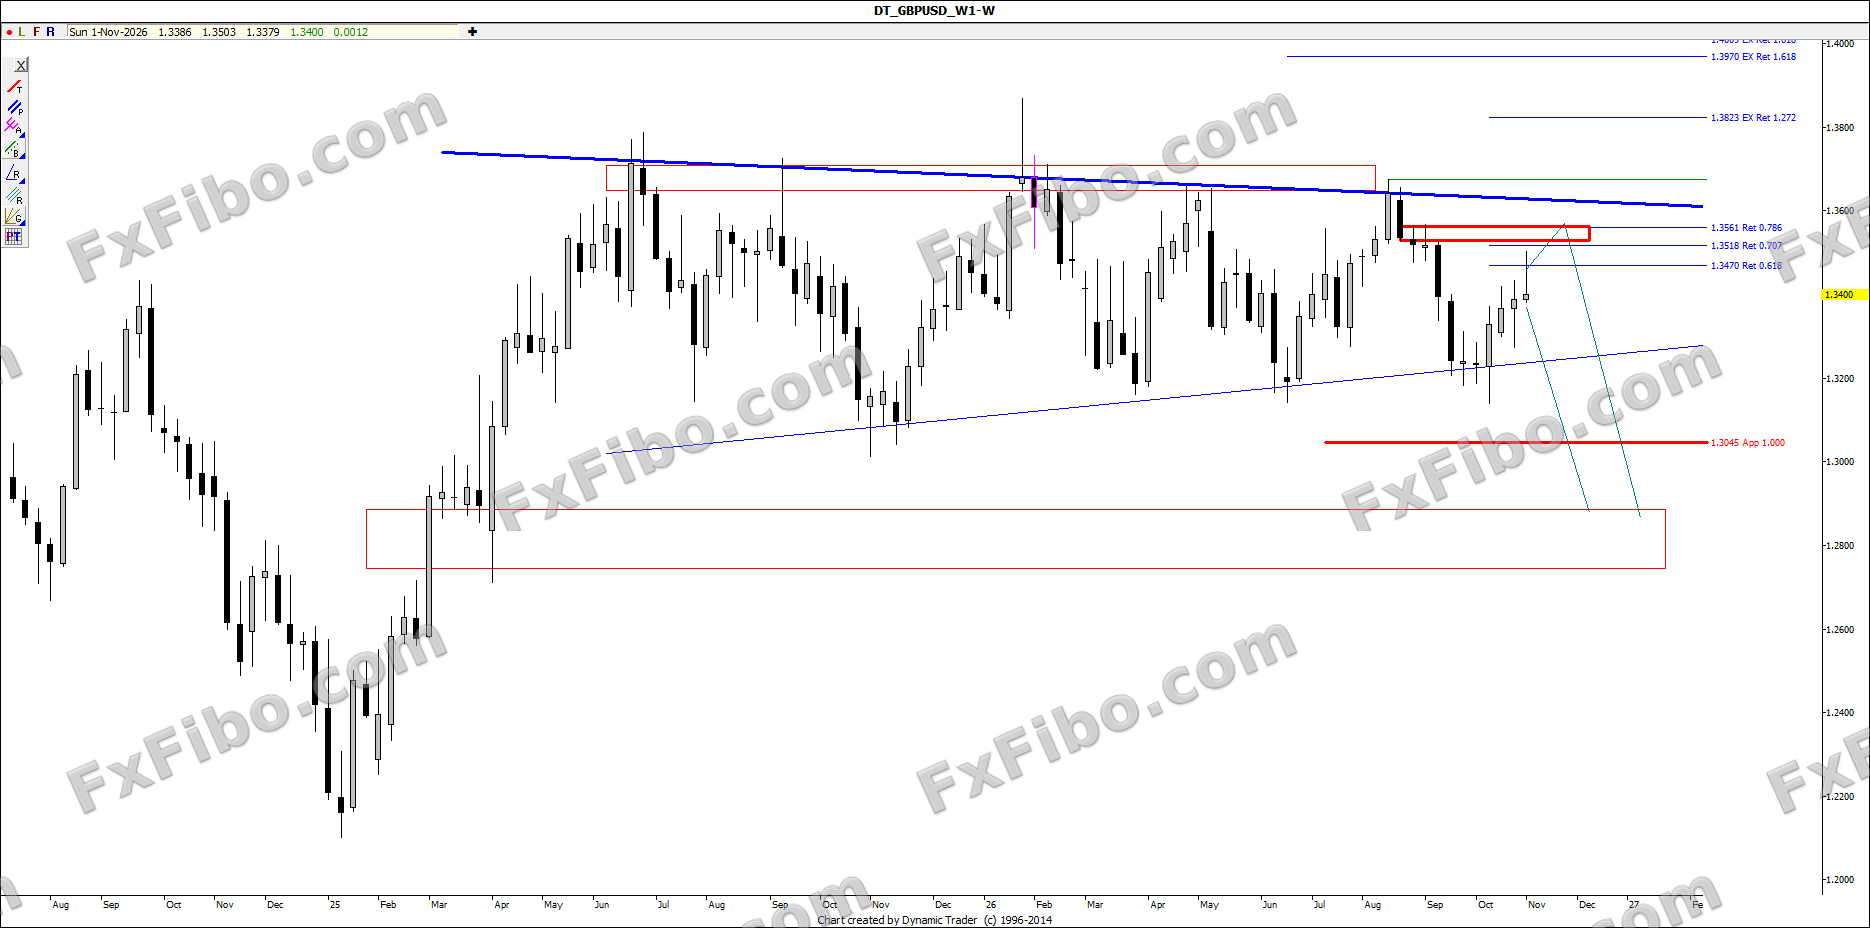
GBP/USD is trading inside a triangle: descending resistance near 1.36 and rising support near 1.32. Weekly bias: bearish.
BiasNeutralEntry zone—Stop loss—Target 1—Target 2—StatusActive
Main scenario
Main scenario: a rally into 1.3518–1.3561 (0.707–0.786), then a drop that breaks the triangle floor towards 1.3045 (App 1.000).
Alternative scenario
Extended target: the 1.275–1.29 demand zone.
Key levels
Resistance: 1.3470, 1.3518–1.3561, 1.36 · Support: 1.32, 1.3045, 1.275–1.29
⚠ This analysis is educational and is not a buy or sell recommendation. Trading financial markets carries the risk of losing capital.