
EURUSDDailyNeutral
EUR/USD daily analysis — 6 November 2026
FXFibo editorial · · 1 min readSummary
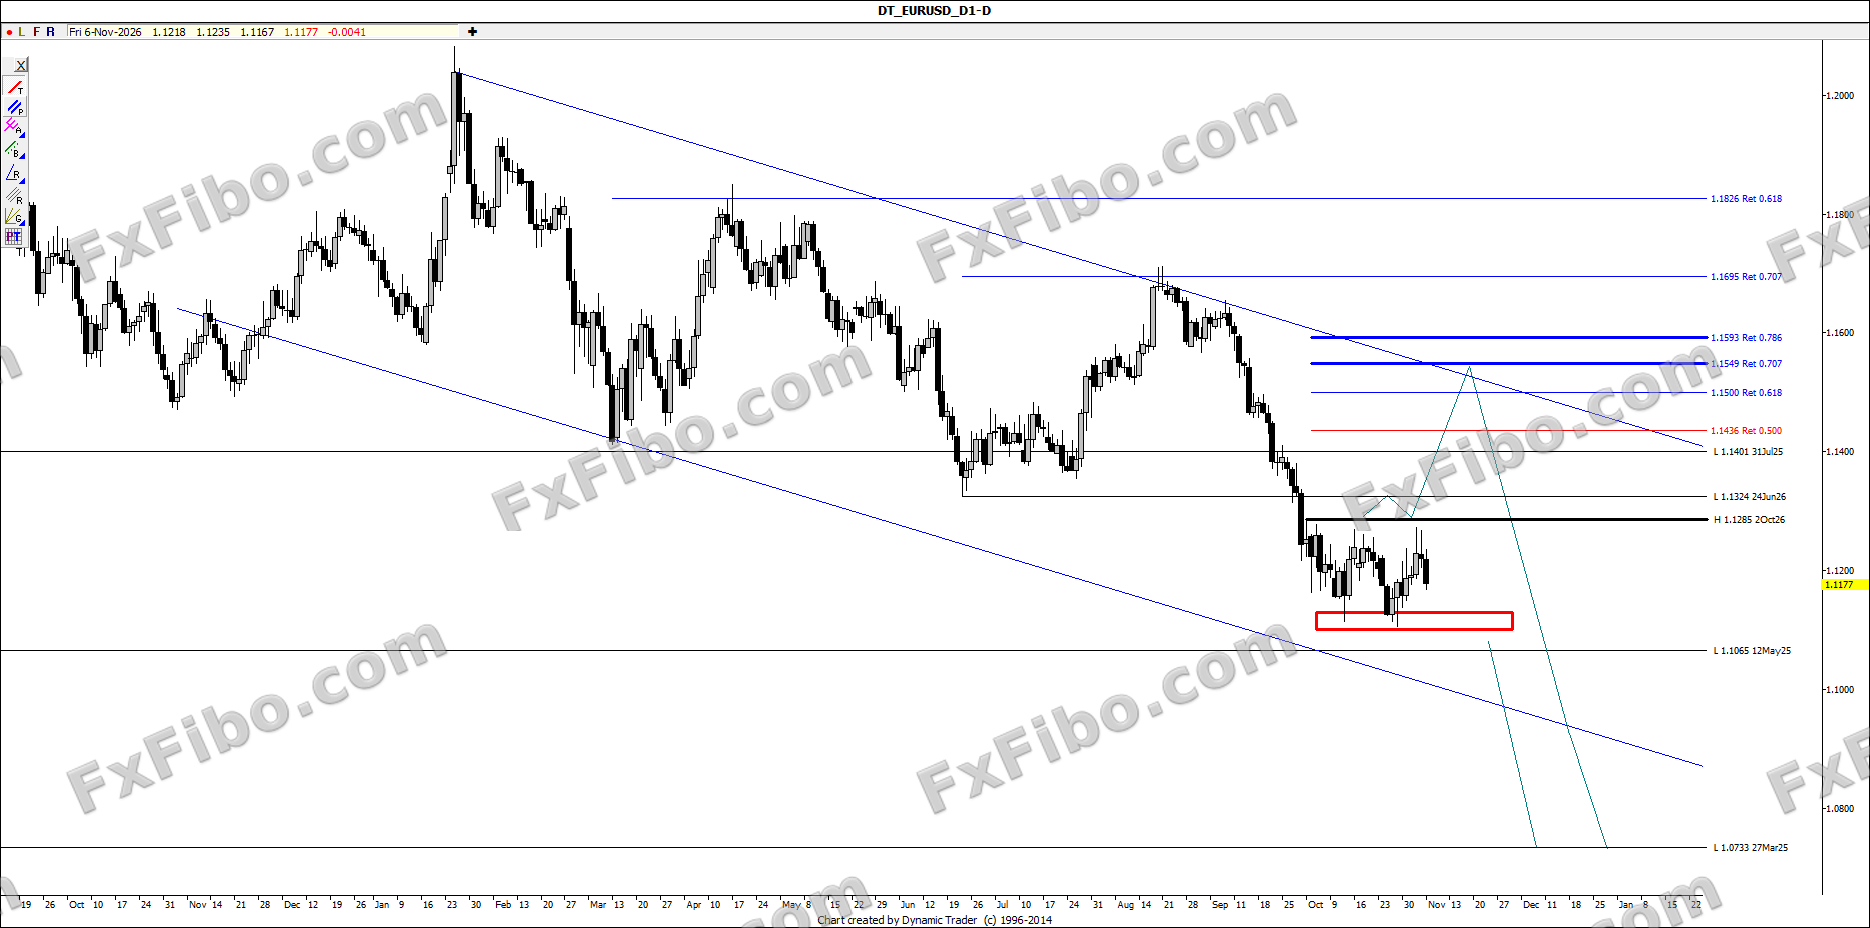
On the daily chart EUR/USD is ranging inside a descending channel, between the 1.1110–1.1130 support zone and the 1.1285 high (2 October 2026).
BiasNeutralEntry zone—Stop loss—Target 1—Target 2—StatusActive
Main scenario
Scenario 1: a break below the support zone targets 1.1065 and then 1.0733 (March 2025 low).
Alternative scenario
Scenario 2: a break above 1.1285 allows a rally to 1.1436–1.1549 (channel top) before the downtrend resumes.
Key levels
Resistance: 1.1285, 1.1324, 1.1436, 1.1549 · Support: 1.1110–1.1130, 1.1065, 1.0733
⚠ This analysis is educational and is not a buy or sell recommendation. Trading financial markets carries the risk of losing capital.