
DXYDailyBullish
US Dollar Index (DXY) daily (SMC): buy the 101.10–101.40 zone
FXFibo editorial · · 1 min readSummary
The daily structure in US Dollar Index (DXY) is bullish: a bullish break of structure (BOS) at 102.535, with price now around 101.65. The 101.10–101.40 area is the main buy zone.
BiasBullishEntry zone101.30Stop loss100.85Target 1102.36Target 2102.95StatusActive
Invalidation: Daily close below 100.87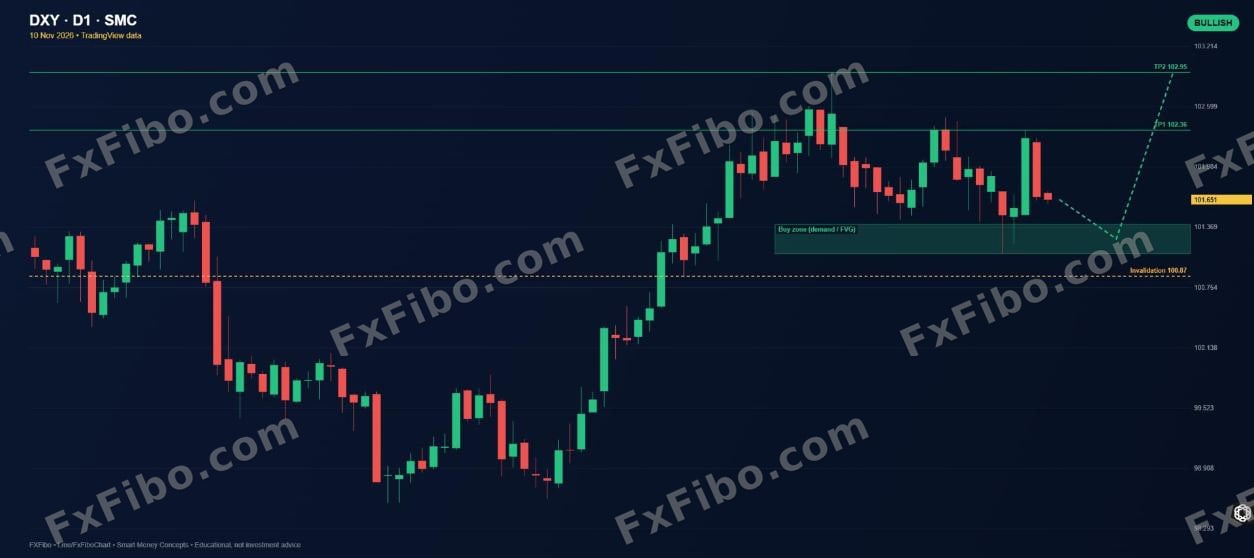
Main scenario
- Entry zone: 101.10–101.40 (around 101.30)
- Stop: 100.85
- Targets: 102.36 and 102.95
- Enter after candle confirmation or an aligned CHoCH on a lower timeframe
Alternative scenario
A daily close below 100.87 invalidates the main scenario and opens the way to 100.87.
Key levels
- Resistance: 102.36, 102.54, 102.95
- Support: 101.40, 101.10, 100.87
Market-moving events
- Tue 10 Nov: US CPI
- Thu 12 Nov: UK GDP and US jobless claims
- Fri 13 Nov: US PPI and euro-area GDP
⚠ This analysis is educational and is not a buy or sell recommendation. Trading financial markets carries the risk of losing capital.