Fibonacci Retracement Explained: How to Draw It and Trade It (Step-by-Step Guide)
Fibonacci retracement marks the levels where a pullback is likely to stop: 0.382, 0.5, 0.618 and 0.786 of the previous move. This guide shows how to draw it correctly, which level matters most and how to build a trade around it.
Contents
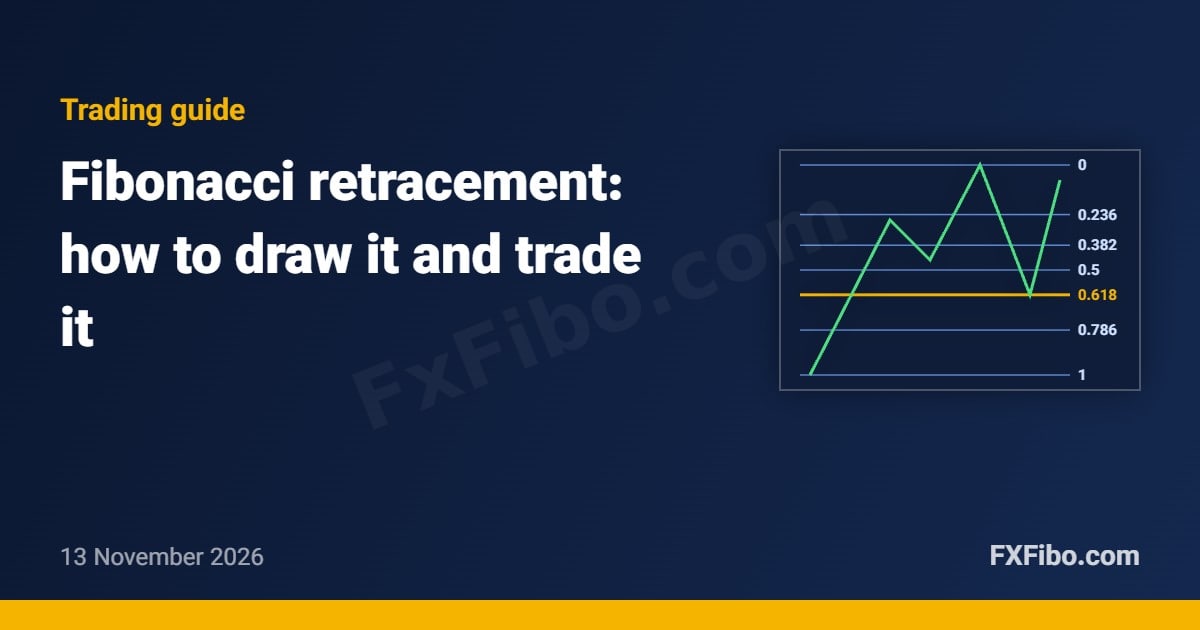
Short answer: Fibonacci retracement is a tool that measures how far price is likely to pull back inside a trend before the trend resumes. You draw it from the start to the end of a price swing, and it marks the 23.6%, 38.2%, 50%, 61.8% and 78.6% levels of that swing. The 61.8% level, known as the golden ratio, is the most watched.
Where do the Fibonacci ratios come from?
The ratios come from the Fibonacci sequence (1, 1, 2, 3, 5, 8, 13, 21, 34…), in which each number is the sum of the two before it. Dividing a number by the next one gives about 0.618; dividing by the number two places ahead gives about 0.382. The 0.5 level is not a Fibonacci ratio, but traders use it because markets often retrace half of a move.
| Level | What it usually means |
|---|---|
| 0.236 | Very shallow pullback in a strong trend |
| 0.382 | Normal pullback in a healthy trend |
| 0.5 | Half of the move; a widely watched level |
| 0.618 | Golden ratio; the most important retracement |
| 0.786 | Deep pullback; last line before the trend is in doubt |
How to draw Fibonacci retracement correctly
- Find a clear swing. Pick an obvious move with a clear swing low and swing high. Small, choppy moves give unreliable levels.
- Uptrend: draw from the swing low (100%) to the swing high (0%). The levels appear below price as possible support.
- Downtrend: draw from the swing high to the swing low. The levels appear above price as possible resistance.
- Be consistent. Use either wicks or candle bodies, and stick to your choice on every chart.
- Start on a higher timeframe. Levels from the weekly and daily charts carry more weight than those on a 15-minute chart.
Which Fibonacci level is most important?
- In a strong trend, price often stops at 0.382.
- In a normal trend, the 0.5–0.618 zone (often called the golden zone) is where most pullbacks end.
- If price breaks 0.786 with a strong close, the previous move is likely over and a deeper correction or reversal is possible.
How to trade with Fibonacci retracement
- Look for confluence. A Fibonacci level is much stronger when it lines up with a previous support or resistance, a trendline, a channel or a round number.
- Wait for confirmation. Do not buy or sell blindly at the level. Wait for a reaction such as a pin bar, an engulfing candle or a break of structure on a lower timeframe.
- Place the stop beyond the next level or beyond the swing that formed at the level.
- Set targets at the previous swing high or low, then at the extensions 1.272 and 1.618.
- Size the position so a stop-out costs no more than 1–2% of your account.
Real example: EUR/USD monthly chart
In our EUR/USD forecasts of 12 November 2026, the monthly chart had broken its rising channel and lost the 0.382 retracement at 1.1354. Price was testing the 0.5 level at 1.1130, and the next targets were the 0.618 at 1.0905 and the 0.707 at 1.0735. This is how we use Fibonacci in every analysis: the retracement levels define the entry zone, the invalidation level and the targets.
Common mistakes
- Drawing from random points instead of clear swing highs and lows.
- Treating every level as a guaranteed turning point.
- Ignoring the higher-timeframe trend.
- Entering without a stop loss, or with a stop that is too tight for normal volatility.
Frequently asked questions
Does Fibonacci retracement really work?
It works best as a map of likely reaction zones, not as a prediction. Its value comes from confluence with other levels and from many traders watching the same prices.
Which timeframe is best for Fibonacci?
Any timeframe works, but levels from the weekly and daily charts are the most reliable. Use lower timeframes to time the entry.
What is the difference between retracement and extension?
Retracement measures pullbacks inside the previous move (below 100%). Extension projects targets beyond it, such as 127.2% and 161.8%.
Is 0.5 a Fibonacci level?
Not mathematically, but it is included in most Fibonacci tools because markets often retrace about half of a move.
See key terms in our forex glossary and daily Fibonacci-based forecasts.
Questions? Telegram support @fibonacci_chart
Educational content only, not investment advice. Past results do not guarantee future results.
Forex and CFD trading carries a high level of risk due to leverage and you may lose more than your initial capital. Content on this site is educational and not investment advice.
Get curated analysis every Friday
5 key events, 2 curated analyses and one tool or lesson — one-click unsubscribe.