
USOILDailyNeutral
WTI crude oil daily analysis — 6 November 2026
FXFibo editorial · · 1 min readSummary
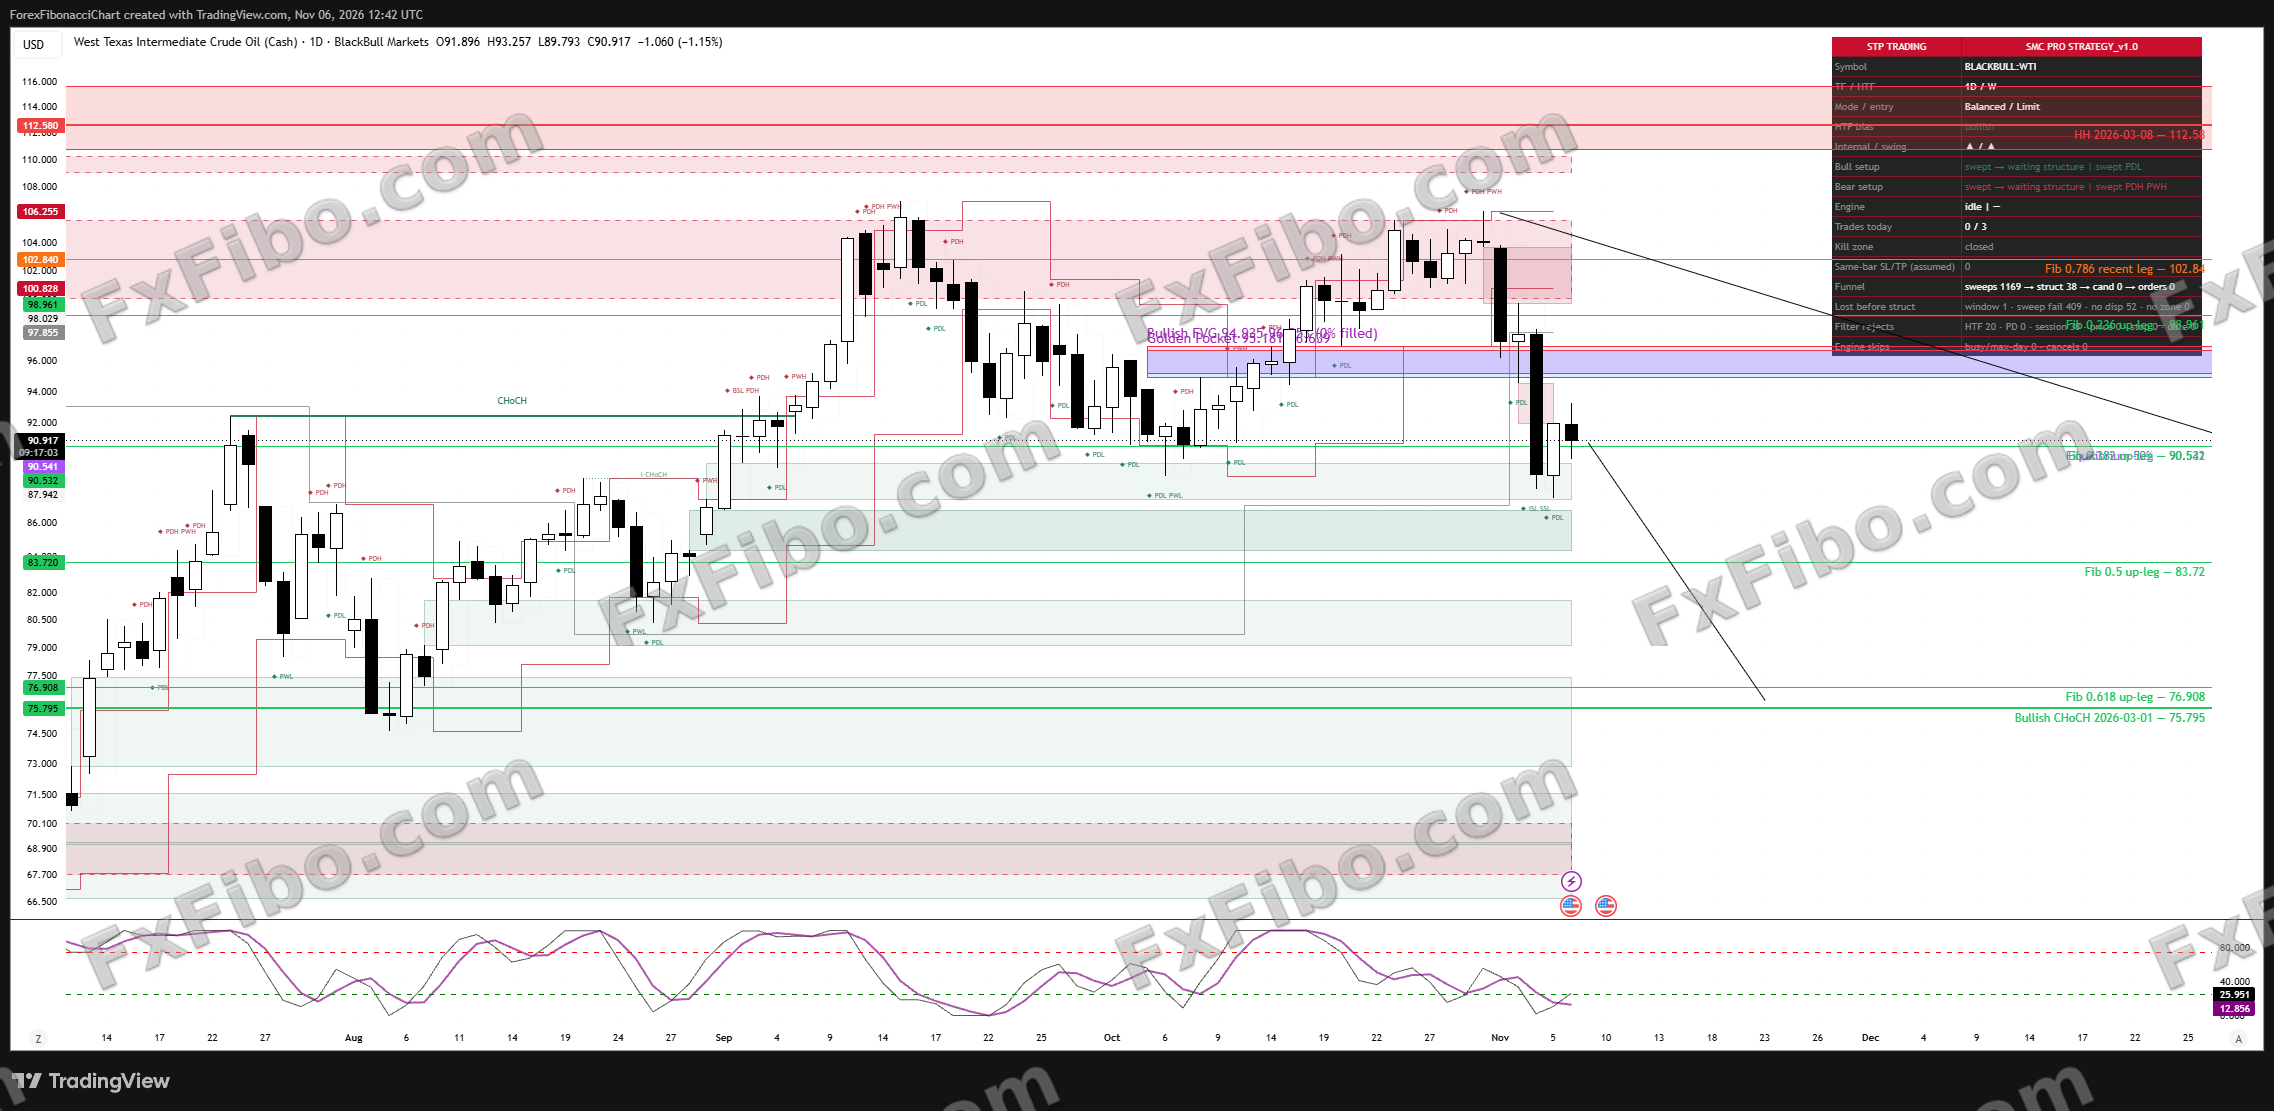
On the daily chart WTI is below the 95.2–96.9 zone, which now acts as resistance, and is testing the 90.5 support.
BiasNeutralEntry zone—Stop loss—Target 1—Target 2—StatusActive
Main scenario
Main scenario: losing 90.5 targets 83.72 and then 76.9–75.8.
Alternative scenario
A daily close back above 96.9 would invalidate the bearish view.
Key levels
Resistance: 95.2–96.9, 98.0, 100.8, 102.84 · Support: 90.5, 87.9, 83.72, 76.91, 75.80
⚠ This analysis is educational and is not a buy or sell recommendation. Trading financial markets carries the risk of losing capital.